views
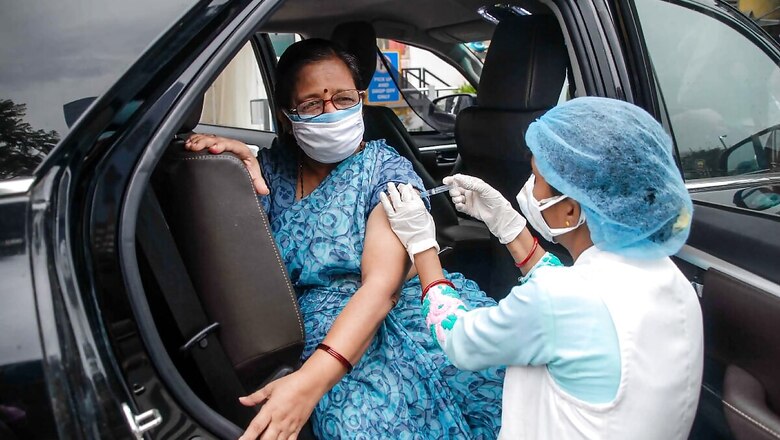
The Centre on Tuesday hit out at the State/UT governments over slow Covid-19 vaccination drive across the country, saying it was their mismanagement that was leading to the slow pace of the inoculation drive. States and Union Territories, on the other hand, blamed the Union government over acute shortage in vaccine doses.
The vaccination drive for the 18-44 age group has been partially rolled-out in a few states while some are yet to begin vaccinating the said population base. A few states have withheld the drive because of vaccine crunch.
The data released by the Central government, however, hints at a mismatch between the available vaccine doses and the daily vaccination across states. According to the data, the states had much more vaccine doses available with them than number of inoculations that took place everyday.
Vaccine given to state governments/Union Territories
By
Doses (crore)
Consumption/wastage (crore doses)
Balance (doses)
Vaccination (jabs)
16-May
20.76
18.71
2,04,96,525
6,91,211
15-May
20.28
18.43
1,84,41,478
17,33,232
10-May
18
17.09
90,31,691
25,03,756
9-May
17.93
16.89
1,04,30,063
6,89,652
8-May
17.56
16.83
72,42,014
18,93,258
7-May
17.49
16.65
84,08,187
21,27,057
6-May
17.35
16.44
90,30,670
22,98,530
5-May
17.15
16.26
89,31,505
18,90,346
4-May
17.02
16.07
94,47,614
14,84,989
3-May
16.69
15.94
75,24,903
17,08,390
2-May
16.54
15.79
75,71,873
12,10,347
1-May
16.54
15.76
78,60,779
18,26,219
30-Apr
16.37
15.58
79,13,518
27,44,485
29-Apr
16.33
15.33
1,00,28,527
22,24,548
28-Apr
16.16
15.1
1,06,08,207
21,93,281
27-Apr
15.95
14.89
1,06,19,892
25,56,182
26-Apr
15.65
14.64
1,00,47,157
33,59,963
The table above compiles data from the Ministry of Health on vaccine doses given freely to the states and union territories, its consumption and wastage and the balance amount of vaccine doses left with the States/UTs.
As states continued to blame the Centre over the shortage of vaccine doses, the Union health ministry began to release daily notes since April 27 on the distribution of vaccines, putting the onus on the states for the lag in vaccination drive.
The data released by the ministry indicates that the pace of daily vaccination has only been a fraction of the vaccine doses available with the states.
Balance Doses/Daily Vaccination
16-May
3.37%
15-May
9.40%
10-May
27.72%
9-May
6.61%
8-May
26.14%
7-May
25.30%
6-May
25.45%
5-May
21.16%
4-May
15.72%
3-May
22.70%
2-May
15.98%
1-May
23.32%
30-Apr
34.68%
29-Apr
22.18%
28-Apr
20.67%
27-Apr
24.07%
26-Apr
33.44%
When we compare the daily vaccination data with the balance of vaccine doses available among states and union territories on that day, we find
The proportion of vaccination went as low as 3.37% on May 16 and 6.61% on May 9, showed the data. It never crossed the 50% mark, but remained between 20-35% conversion of balance vaccine doses to administered ones.
Therefore, it is a wonder why the States/UT governments have not been able to convert the balance quantity of vaccine doses to its maximum utilisation. The process of vaccination for the 94 crore adults in our country cannot be scaled up unless the factors responsible for the lag in vaccine balance conversion is ascertained.
Read all the Latest News, Breaking News and Coronavirus News here. Follow us on Facebook, Twitter and Telegram.


Comments
0 comment