views
Today, Flurry Analytics, division of Yahoo, Inc. announced the findings for “State of the App Nation in India” – the study uncovers insights around mobile app activity and their usage, emerging growth categories and device adoption trends in India.
The ‘State of the App Nation in India’ study is backed by data gleaned from over 940,000 applications, across 2.1 billion global devices from across the world, and the 58,000 apps, across 147 million devices from India, that use Flurry.
The trends show Asia and India leading the phablet revolution. The phablet (devices with screens between 5” and 6.9”) is the fastest growing mobile device globally. In India, phablets have a market share of 61 percent, outpacing growth in the US which has 48 percent market share. When looking into the mobile usage in India, one major trend emerged: India’s mobile usage looks a lot like global usage did six months ago, still ascending on the growth curve but not at the rate we saw the year prior.
Key Insights and Trends from Flurry: State of the App Nation in India (All data as measured by Flurry YoY from 2015 - 2016)
India’s app usage grew 43 percent YoY: The India app usage grew at 92 percent during the same period last year (2015).
- Asia and India are leading the phablet revolution:
- Indian mobile consumers are phablet lovers, with the form factor size securing 61 percent of the market share in India. This footprint is also the driving force behind global adoption figures.
Diversification of apps: App categories seeing the fastest growth in India
The top 3 app growth categories in India are Music, Media and Entertainment followed by Business and Finance apps, and Utilities and Productivity apps.
- Music, Media and Entertainment applications saw the biggest usage increase at 188 percent YOY, which can be attributed to rise of phablet devices and better Internet connectivity in India
- Business and Finance apps grew 176 percent YoY
- Utilities and Productivity apps grew 99 percent YoY
- Messaging and social apps remain one of the most engaged categories in Asia and India: Time-spent in Messaging and Social apps grew by an impressive 52 percent in India and 44% globally.
- Personalization apps see decline: Much like the global trends, Personalization apps saw the biggest usage decrease at -32 percent. This decrease is due to operating systems integrating the functionality of these apps natively.
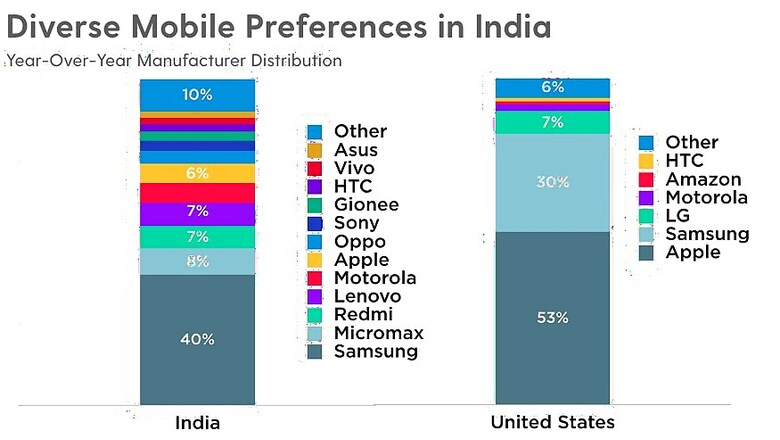
- Indian mobile consumers have very diverse tastes while selecting their mobile manufacturer: More than 12 mobile makers have a substantial footprint locally with Samsung leading with 40 percent market share, followed by brands like Micromax, Redmi and Lenovo. This is an interesting phenomenon, compared to mobile manufacturer popularity globally where on average there are about six major mobile manufacturers.
- Sticky Apps Tied to Daily Habits: Some of the most successful app categories throughout the years have tapped into the mobile addict population. They’re also apps that rely on live data, such as Business and Finance (up 43 percent globally in time-spent; up 176 percent in India). Interestingly in India, this trend is best seen in Health and Fitness app usage (up 27 percent locally). These apps see high hourly engagement throughout the day, as users turn to their mobile and wearable devices to track their fitness goals and progress.
- Shopping Apps Spell the Doom and Gloom of Brick and Mortars: In 2016, shopping apps continued to gain popularity, growing 31 percent globally and 12 percent in India.
- Video Killed the Gaming Star: Gaming, the app category known as “the darling of the mobile industry,” saw time-spent decline by 4 percent globally and a small growth in India of just 8 percent.
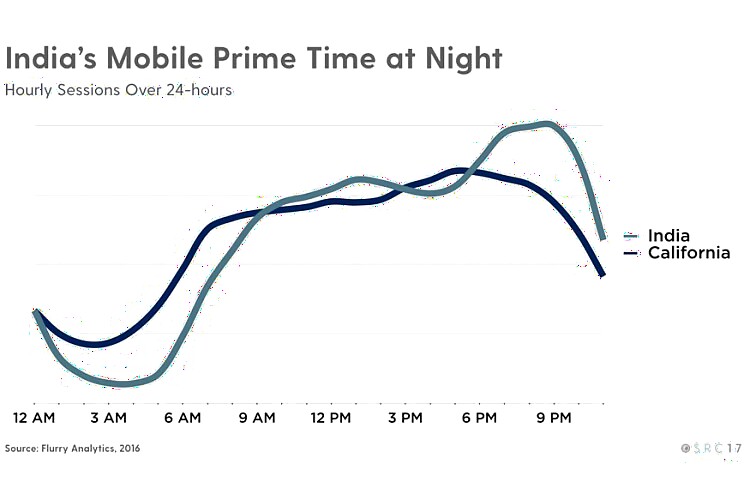
- Mobile consumers in India are night owls: with peak usage rolling in around 9PM. Indian users are generally slower to turn to their phones in the morning but quickly scale usage throughout the later morning hours.
Top Global Trends
The burgeoning trend of ‘Communitainment’ (or, social sharing of media) is driving mobile consumers to spend more than 2 hours/day on Social and Messaging apps.
The average mobile consumer spends just under 5 hours a day on their smartphones.
Shopping applications saw over 17 billion sessions in 2016; effectively changing retail window shoppers into mobile impulse buyers.
Compared to 2015, global app usage grew by 11 percent in 2016. In previous years, we’ve seen all app categories grow in tandem; however, for 2016 year the story is different. In 2016 mobile apps started eating their own, with session and time-spent growth in some app categories occurring at the expense of others. While Messaging and Social apps use rose year-over-year by 44 percent, Personalization apps (like emoji keyboards) declined by 46 percent.





Comments
0 comment