views
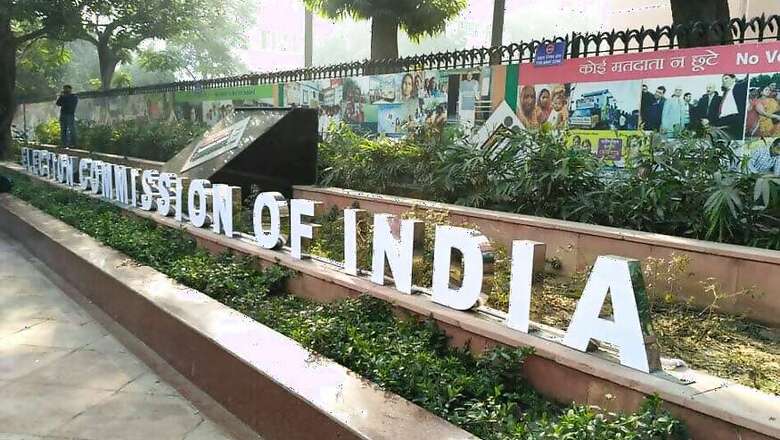
New Delhi: The Election Commission was at the receiving end of several questions last week over the alleged mismatch in voter turnout across hundreds of seats in the recently concluded Lok Sabha elections. Responding to the allegations on June 1, the poll panel dismissed the doubts over its data, saying the figures on voter turnout were “provisional”.
But, the mismatch runs deeper, dating back to the 2014 general elections as well.
An analysis by News18.com has revealed that the voter turnout data till the third phase of the 2019 elections released by the EC gives different figures in different reports published on different dates. It is not just the voter figures, but the elector count also shows a mismatch in different reports released by the EC. Adding to the confusion and raising bigger questions, the elector count and turnout figures released last year for the 2014 elections do not match with the latest data released in 2019.
Since the election dates were announced, the EC has been releasing multiple reports, including the seizure reports, Model Code of Conduct violations, turnout and finally the results. During the elections, the Suvidha App provided the estimated data on voter turnout followed by a final report based on updated numbers on the EC website.
The reports for the first phase on April 11 and the second on April 18 were released on April 24, i.e. after the third phase. The figures given for the first and second phase in the report released on April 24 are different from the report uploaded on May 22.
The analysis discovered at least 75 discrepancies in the data provided by the EC for the first phase. For instance, the April 24 report stated that there were nine electors from the ‘Other’ category in Andaman and Nicobar Islands; and that a total of 1,912 voters from the ‘Other’ category voted in the first phase. This means that the voter turnout of the ‘Other’ category in the union territory was 212 times the total ‘Other’ electors. In the May 22 report, apart from updating the ‘Other’ voters to two, the total voters’ count was updated from 2,07,208 to 2,06,865.
In another discrepancy, total voters in Andhra Pradesh were listed as 3,92,48,077 in the April 24 report. The same figure changed to 3,93,45,717 in the May 22 report, i.e. an increase of 97,640 voters.
Similarly, there were 59 inconsistencies in the report for the second phase, and 35 for the third. The EC in its response stated that “the data is estimated and subject to change”. However, when these reports were out, it was marked ‘updated’ for the first, second and fourth phases, and ‘provisional’ against the sixth and seventh phases.
The disclaimer against the reports for all phases was changed to ‘provisional data’ on May 27.
Apart from the different figures for the voters, the elector counts for nine of the 20 states that voted in the first phase were different in the two reports. The count differed in the two reports for five of the 12 states that voted in the second phase; and for three of the 15 states that voted in the third. The report of the third phase was released on May 4, after the fourth phase (April 29). As on May 27, the total views and downloads of these reports were 93,529 and 29,712, respectively.
In response, the EC said, “In earlier elections, it used to take months to collect such authenticated election data from all the ROs. Even in 2014, it took 2-3 months after the declaration of results to collect and collate such data in authenticated form. Due to the innovative IT initiatives taken by the commission this time, the final data on votes counted has been made available within a few days of declaration of results.”
An official on condition of anonymity revealed that the discrepancies mounted due to the lack of understanding of the Suvidha App. The official said, “Earlier, the figures used to be updated based on the cards (Form 17C) that were handed over. The new app (Suvidha) which has been introduced for collecting and transmitting information has not been very successful. Many people have misunderstood or not understood its operation.”
While this may justify the discrepancies in the number of voter count, it fails to explain the mismatch in elector number for 2019.
Not a New Phenomenon
Inconsistencies can be noticed in the 2014 voter and elector count as well when two of the commission’s reports released in 2018 and 2019 are compared. There was no Suvidha App in that period.
News18.com analysed the numbers available for phases one to five as the report for the sixth and seventh phases were marked ‘provisional’ and hence were not considered in this analysis. Therefore, the analysis excludes figures on Bihar, Chandigarh, Delhi, Haryana, Himachal Pradesh, Jharkhand, Madhya Pradesh, Punjab, Uttar Pradesh and West Bengal as the polling in these states ended in the sixth and/or the seventh phase.
Even Telangana was excluded from the analysis as the 2019 report does not include the 2014 figures for the state.
The findings showed that elector and voter count were different in the two reports for all the 286 constituencies analysed. The mismatch in numbers varied from a difference of mere one digit to about six and seven. Moreover, none of the reports mentioned state any disclaimers to possibly justify the dissimilarity in numbers. For four states and one union territory – Andhra Pradesh, Arunachal Pradesh, Assam, Sikkim, and Daman and Diu – the voter turnout was different for the same election, over 1 per cent.
The 2018 report from which the figures have been extracted has been downloaded more than 15,000 times as on June 2. This poses serious questions on the data repository mechanism of the EC. Calling it a ‘serious’ issue, Sanjay Kumar, director at the Centre for the Study of Developing Societies, told News18.com, “It is a very poor reflection of how the results are being stored and put out by the Election Commission.”
The Election Commission is yet to respond to queries by News18.com. The report will be updated as and when a response is received.


Comments
0 comment